(www.MaritimeCyprus.com) “World Trade Statistical Review” looks into the latest trends in global trade, with in-depth analysis of what is being traded and who the key players are. It also reviews the latest developments in trade policy-making in areas such as trade facilitation and trade-restrictive measures. Analytical chapters are complemented by over 60 tables providing a detailed breakdown of the goods and services being traded and the leading exporters/importers.
World trade and GDP slowed in 2018 as trade tensions increased World trade faced renewed headwinds in 2018 as trade tensions and economic policy uncertainty rose sharply. Year-on-year growth in the volume of world merchandise trade fell from 3.9 per cent in the first half of 2018 to 2.7 per cent in the second half of the year.
The slowdown became more pronounced towards the end of the year, as relatively strong quarter-on-quarter growth of 1.2 per cent in the third quarter was followed by a decline of 0.3 per cent in the fourth quarter.
Slower trade growth was accompanied by weaker output growth in major economies. For example, G20 countries saw their collective GDP increase at an average year-on-year rate of 3.5 per cent in the second half of 2018, down from 3.9 per cent in the first half.
The loss of momentum in trade and GDP is partly due to tighter monetary policy, increased financial volatility and the raising of tariffs on widely traded goods in major economies. Trade tensions appear to have contributed significantly to
the slowdown.
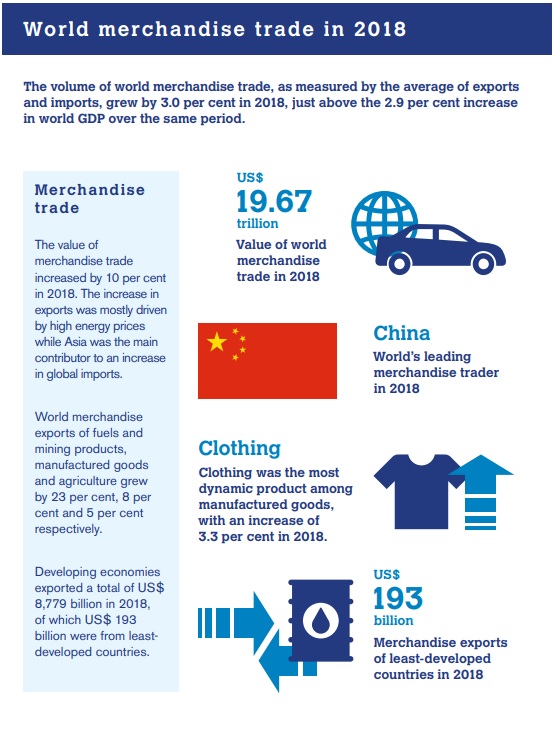
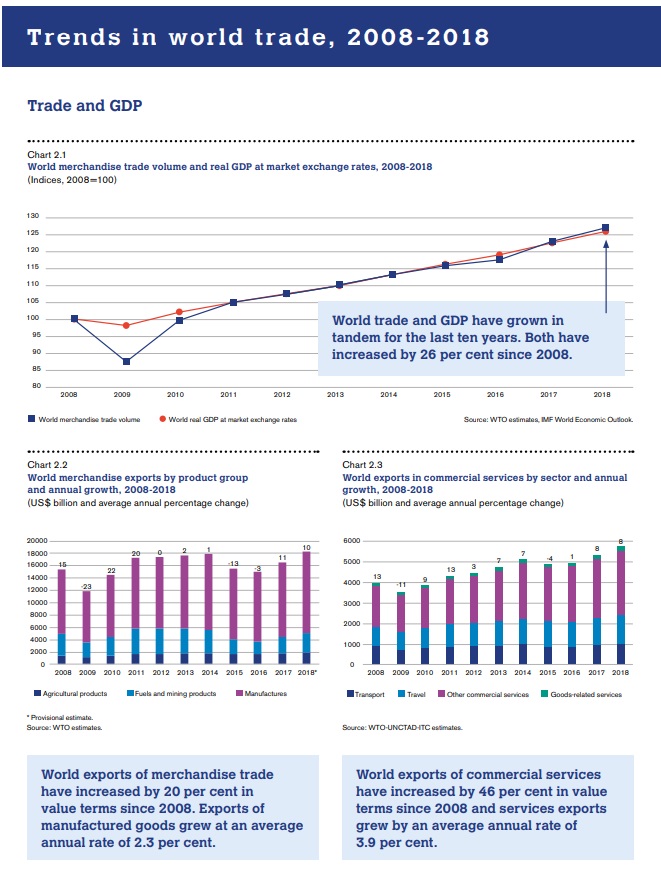
Overall trade growth of 3.0 per cent in 2018 was significantly lower than the 4.6 per cent growth recorded in 2017. This strong growth had suggested a return to the stronger pace of trade expansion that characterized the late 1990s and early 2000s but this was not sustained in 2018. Trade only grew slightly more than output in 2018 after being 1.6 times higher in 2017. However, trade growth remained above the 2.6 per cent average rate since 2008.
To obtain the complete report, click on below image:
Source: WTO


